Introduction
Performance analytics allow you to visualize tickets by grouping them using different values. These reports help you understand how your team is performing across various metrics and identify areas for improvement. Unthread includes a range of out-of-the-box report types to help teams track key support metrics and gain insights into their support operations.Report Types
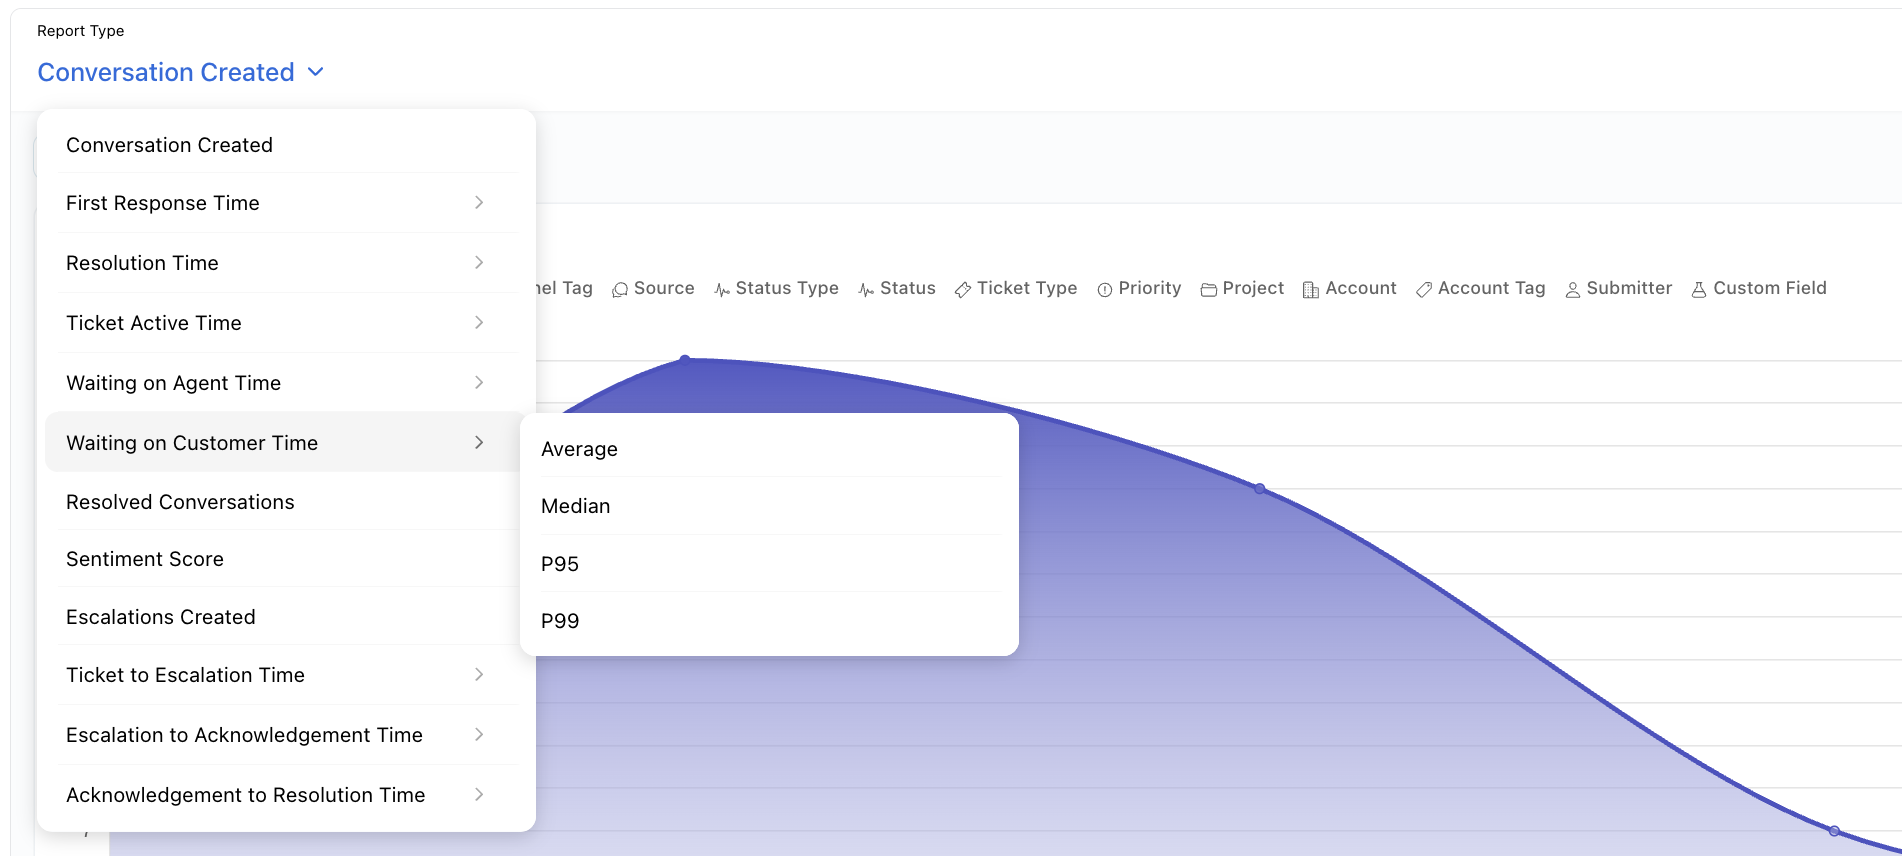
Before reviewing these variables, we’ll review the different report types available in performance analytics. You’ll notice that some of these report types have two variables:- P95 and P99 represent the 95th and 99th percentiles of response times, respectively. This means that 95% (or 99%) of requests are completed within the reported P95 (or P99) latency.
Core Performance Metrics
- Conversations Created: Total number of tickets opened
- First Response (FR) Time (in minutes): Time between ticket creation and first response by an Agent. A teammate’s response won’t be counted as a first response. Agents can use emoji triggers to manually set the FR message.
- Resolution Time (in minutes): Time between ticket getting created and resolved. -If a ticket gets created at t0, closed at t1, re-opened at t3, and re-closed at t4, the resolution time will be the time between t0 and t4
- Waiting on Customer Time: Total amount of time the ticket is in Open status
- Waiting on Agent Time: Total amount of time the ticket is in In Progress status
- Ticket Active Duration: Total amount of time the ticket is in In Progress or Open status type
Escalation Reports
- Ticket to Escalation Time: Time from ticket creation to when it’s escalated by a team member
- Escalation to Acknowledgement Time: Time between when an escalation is created and when it’s acknowledged by the partner team
- Acknowledgement to Resolution Time: Time from when the escalation is acknowledged to when it’s resolved. Note: This refers specifically to the resolution of the escalation, not the main ticket. Unless automated, resolving an escalation does not automatically resolve the parent ticket.

Filtering and Breakdowns
All dashboards are fully filterable by default attributes like assignee, date range, tags, ticket type, and status, as well as any custom fields tied to your ticket types. Use the filters at the top of each report to drill down by time, submitters, or specific properties.


Key Performance Insights
First Response Time
Your customers’ first impression of your support often comes down to one thing: how quickly you respond. Analytics helps you track this critical metric from the moment a conversation starts, showing you exactly how quickly your team is serving up solutions. Start by exploring your first response times—this tells you how long customers wait before getting their first reply. Then dive into resolution times to see how efficiently your team closes out issues.Resolution Time
Track how efficiently your team closes out issues and meets customer needs. Monitor trends to identify process improvements and training opportunities.Waiting on Agent Time
Understand bottlenecks in your support process by tracking how long tickets wait for agent attention. Use this data to optimize staffing and workflow.Breaking Down Results
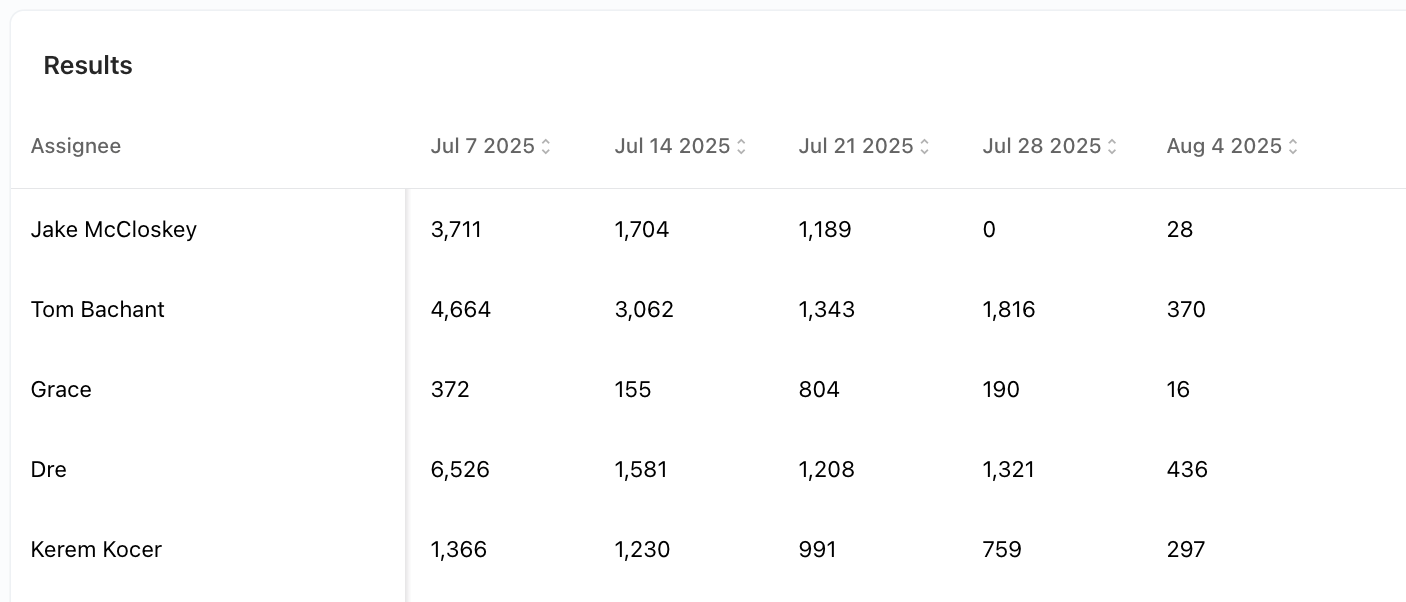
In this section, we’ll dive into how our report viewer can be used to drill down into specific data. For the purposes of this walkthrough, we’ll use the “Conversation Created” report. When viewing any report, you’ll find a number of categories above the chart which can be used to group the data presented. For example, you can select “source” to visualize all conversations created by their source, be it Slack, email, or otherwise. You can also apply this grouping to any custom fields you have configured.Chart Visualization Options
These charts can be visualized in a few ways. You can change this by selecting chart options below the default line chart:- Bar Chart - Useful for comparing different categories
- Card View - Presents you with the actual values for the dataset
- Line Chart - Default view, great for trends over time
These working hours can be set at the project level, so you want to be sure each project aligns with the hours the corresponding team provides support in order to keep the data from being skewed incorrectly.
Sharing and Exporting Reports
Saving Reports
If you have a report that you view frequently, we recommend saving this report. To do so, configure the report with the format that is most helpful and then click the save option in the top right. Saving these reports will also allow you to use the chart in the board builder.Sharing Reports
Share your performance reports with team members, stakeholders, or executives to keep everyone informed about your support team’s performance. Shared reports update automatically, so everyone always sees the latest data. To share a report:- Open any saved report
- Click the “Share” button in the top right
- Copy the generated link
- Send the link to your intended recipients
Shared reports maintain all your filters and settings, so recipients see exactly the same view you’ve configured.
Exporting Data
Download your performance data as CSV files for external analysis, presentations, or reporting to stakeholders. This is perfect for:- Creating custom reports in Excel or Google Sheets
- Sharing data with external stakeholders
- Archiving performance data for historical analysis
- Creating presentations for executive reviews
- Configure your report with the desired filters and date range
- Save the report, if desired.
- Click the download button in the top right

